
Gantt Chart Summary: Benefits and Functions
The Gantt chart is a project scheduling tool that includes a task list on a data grid on the left, and a visualization of task deadlines and dependencies as timelines on the right.
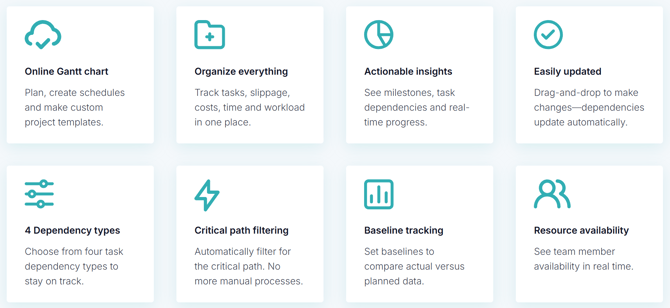
The Gantt is full of robust features to help you plan projects, schedule tasks and track resources. Manage financials, assignees, due dates, and more on this one view.
Tip: Tasks created in other project views will also appear in the Gantt chart view, and vice versa. Use filters and sorting to find the tasks you need in any view.
Gantt Chart Overview Video
Watch our video to learn more about how to add phases, task details and planned versus actual data for your project.
Gantt Chart Advanced Features Video
If you're ready to move past the basics, learn about how to add four different task dependencies, filter for the critical path and print your Gantt or timeline.
What Is a Gantt Chart & How Does It Work?
Gantt charts are visual representations of a project schedule. Key elements include tasks, timeline, start and end dates, dependencies, milestones, percent complete and horizontal bars that represent each task's duration.
While simple timelines can be useful for certain projects, Gantt charts offer a more comprehensive and detailed overview. They're also ideal for real-time collaboration as changes reflect in real time.

Getting Started with the Gantt
In the Gantt view, the left displays a data graph and the visual timeline is displayed on the right side of the page.
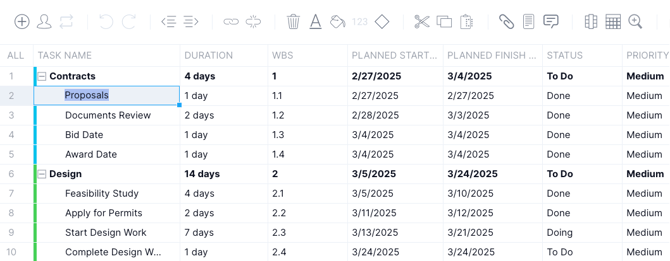
To get started, start typing tasks into the task name column and press Enter to create a new task. Tasks should be listed in order of the desired completion.
Next, click on a task to enter information such as due dates, assignees, etc.
Got questions? Join a live demo this week to get a real-time walkthrough of ProjectManager and get your questions answered in a Q&A session.
Navigating the Timeline
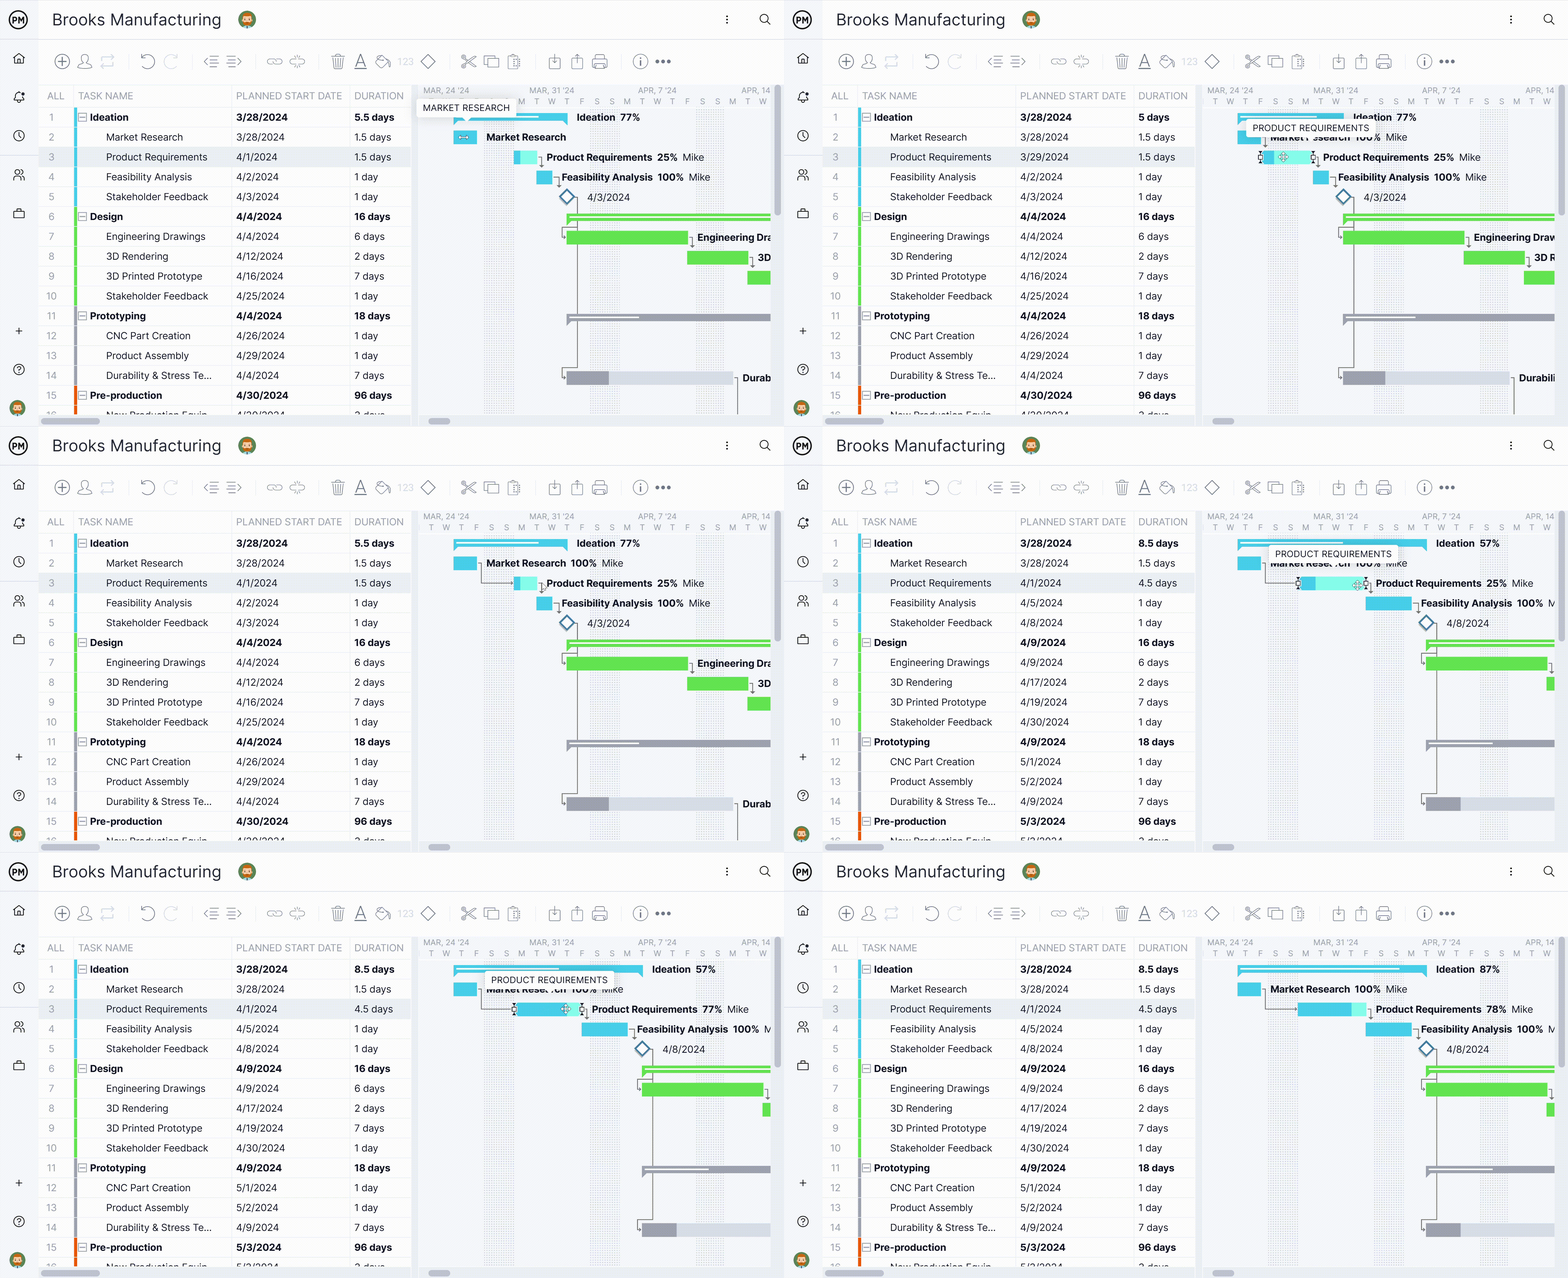
Once your tasks are entered, you can manage your project by adjusting the bars. Simply drag and drop your timeline to make changes. The data on the left will update automatically, as will all dependent tasks. Drag and drop the timeline to
- Change the duration
- Add dependencies
- Adjust progress
- Change start and end dates for tasks
Using the Gantt Data Grid
ProjectManager's Gantt chart has an incredible amount of detailed project data. By leveraging this data, you can schedule tasks with confidence, make better estimates and track your resources as they execute. Here are some common data types our customers love
- Planned Costs, Planned Finish Date, Planned Hours, Planned Resource Cost
- Actual Cost, Actual Finish Date, Actual Hours, Actual Resource Cost
- Baseline Start, Baseline Finish
- Duration
- Percent complete
- WBS
Watch our video to learn more about Gantt data. You can also learn more about customizing Gantt columns.
Hide and Customize Columns
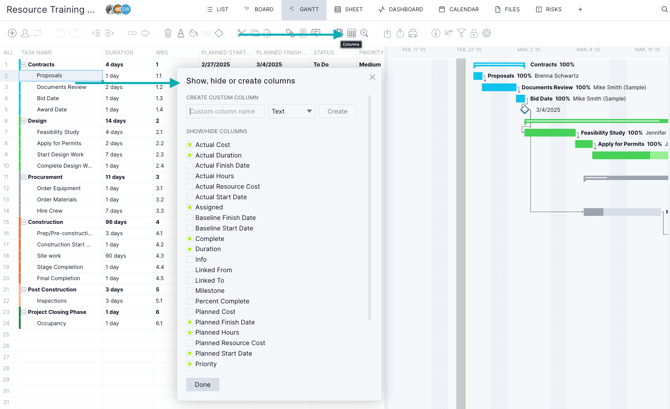
Turn specific columns on or off, depending on the data you'd like to see. You can move columns to their desired location and create custom columns as well.
Gantt Menu with Common Functions
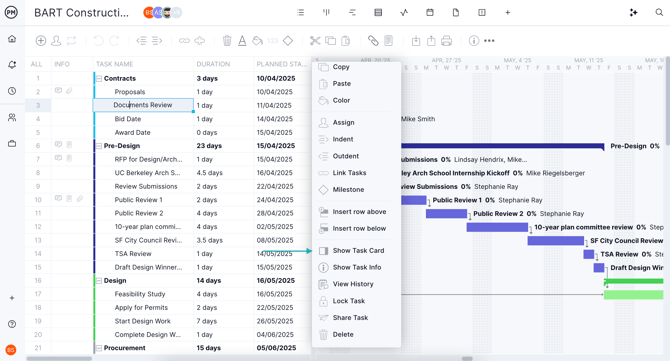
Right-clicking on the Gantt will reveal a menu with the most commonly used functions, such as:
-
Add or link tasks
-
Indent or outdent tasks
- Add milestone
- Show task info
- Lock or delete tasks
- View task history
If you'd like to see an example of a fully built-out Gantt, start a new project, and choose any of our templates.
Tip: When you right-click on the Gantt data grid, you can also click "show task card" to open the task card directly.
Filters & the Critical Path
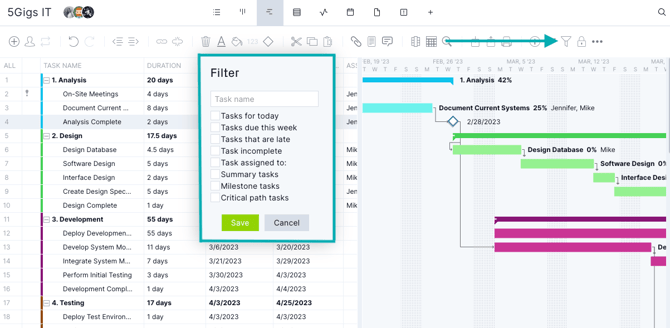
Access the filter by clicking on the filter icon. Filter for specific tasks on the Gantt chart, such as:
- Tasks due today or this week
- Late tasks
- Incomplete tasks
- Milestone tasks
- Summary tasks and more
The critical path represents the longest duration of task activities in a project. When filtering for only critical path tasks, the data grid and the timeline views will adjust automatically. Learn more about how to find your critical path on the Gantt chart.
Task and Resource Management on the Gantt
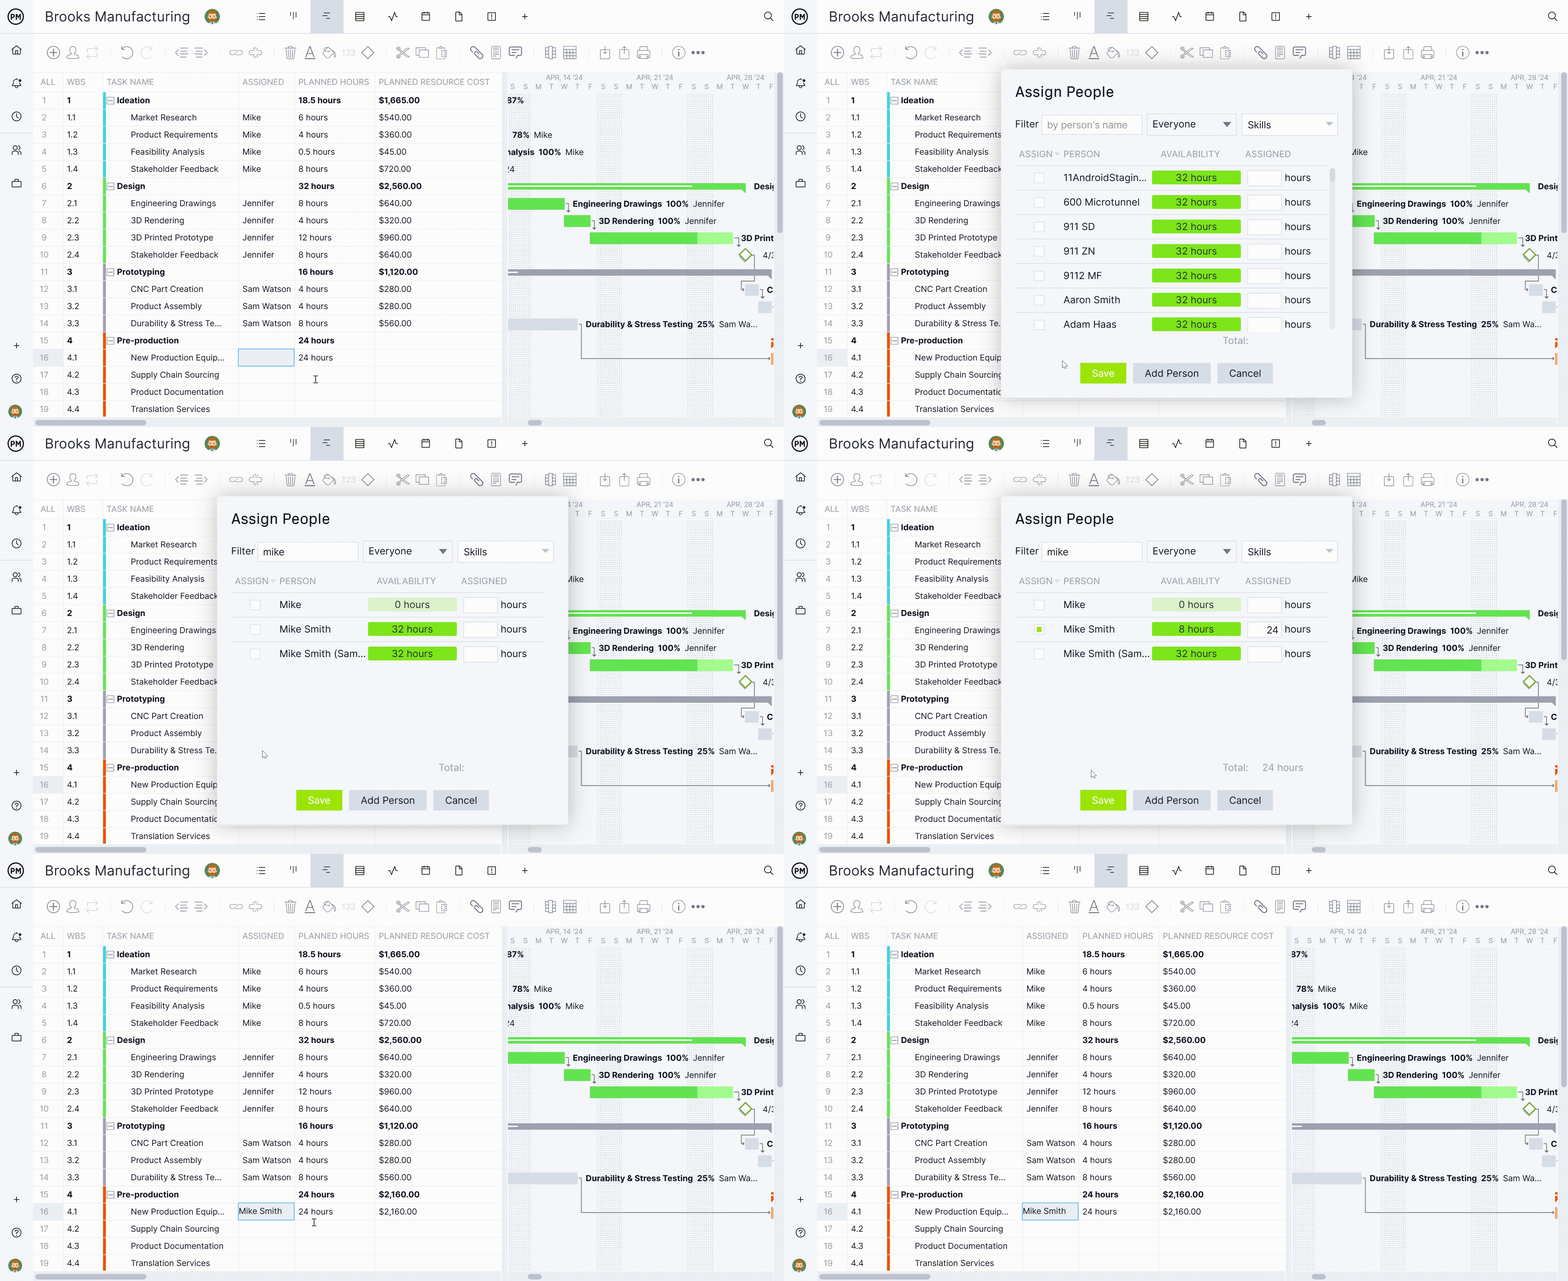
The Gantt chart updates automatically as your team enters task data throughout the software.
- If you've entered a default hourly rate or custom hourly rate for a team member and assigned them hours, the planned resource cost will populate
- Once you assign your task, your planned hours will update
- Once the team member logs hours on a task or a timesheet, the actual resource cost will update automatically.
This information rolls up automatically into your dashboards and reports so you can analyze your projects at a glance, at any time.
Summary Tasks and Phases
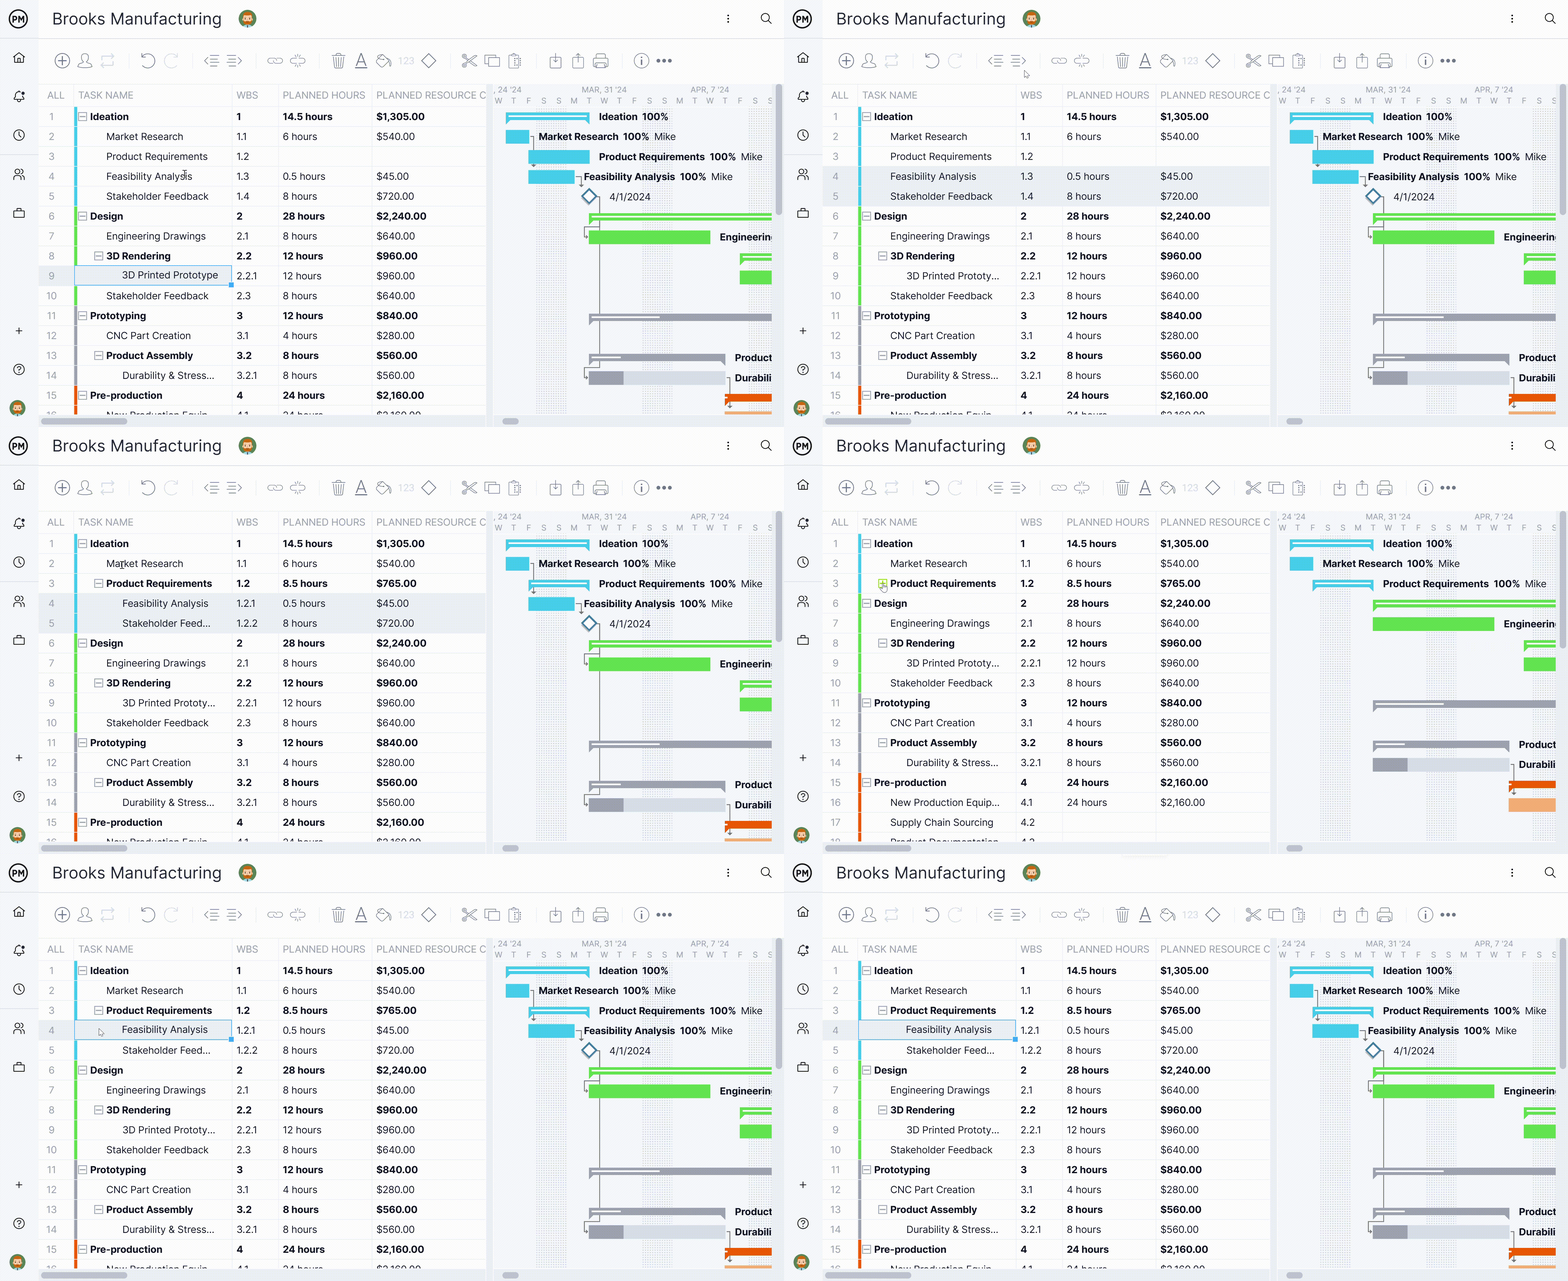
To create a summary task on the Gantt, enter the tasks to the project. Select all rows underneath the summary task and click the indent button. Read more about creating a summary task on the Gantt.
Creating a Milestone
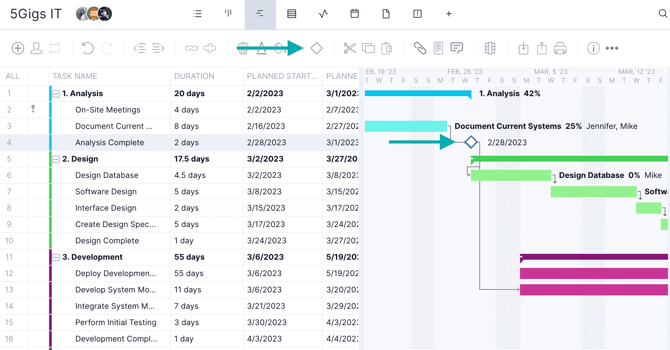
To create a milestone on the Gantt, click the task name in the data grid and click the milestone button.
Use Gantt chart keyboard shortcuts to copy, paste, undo, redo, print, insert tasks, indent, outdent, scroll and more. Learn more about Gantt keyboard shortcuts.
Overview of the Gantt Features
Here's a quick overview of features included in the Gantt. You can find out more specific information about the Gantt and its advanced features by reading the articles in the Gantt section of the Knowledge Base.
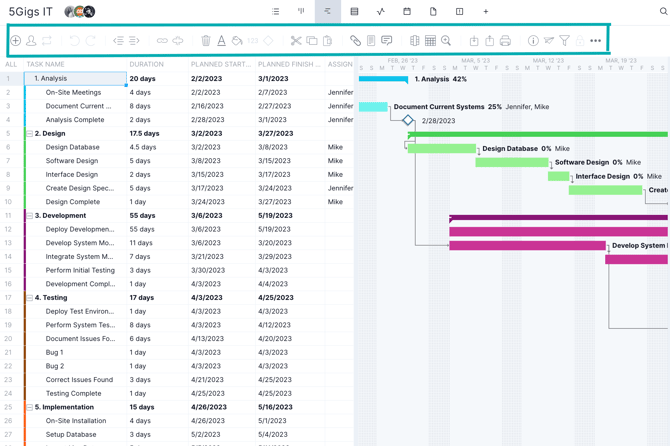
Gantt Ribbon
The Gantt ribbon at the top of the page offers a suite of menu options for customization and data input. These options allow you to create new tasks, assign resources, link tasks, and modify your view.
Data Graph
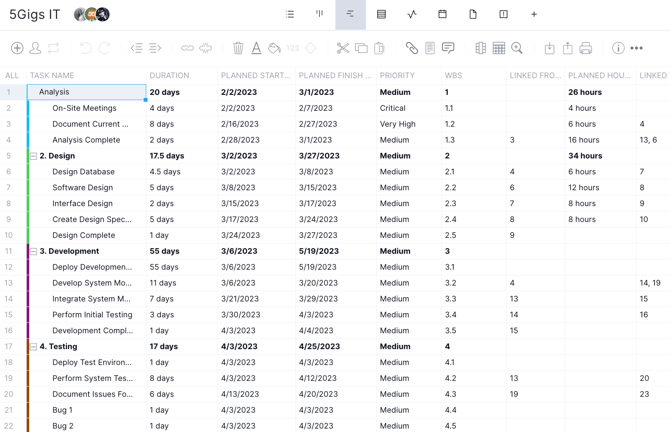
The data graph shows the project data you have entered into the columns. You can move the Gantt slider to the right to see more of the data graph and less of the Gantt.
Import a Project
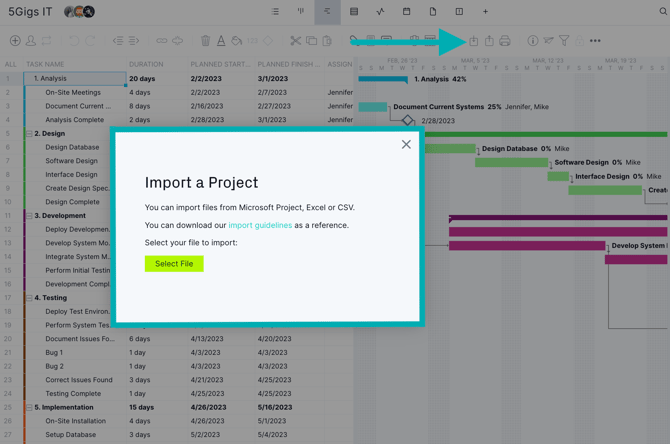
Click the import icon to import files from Microsoft Project, Excel or CSV.
Export Tasks and Timesheets
Click the export icon to export tasks or timesheets. Choose the particular project, assignees, format and columns. Learn more about Gantt chart imports and exports.

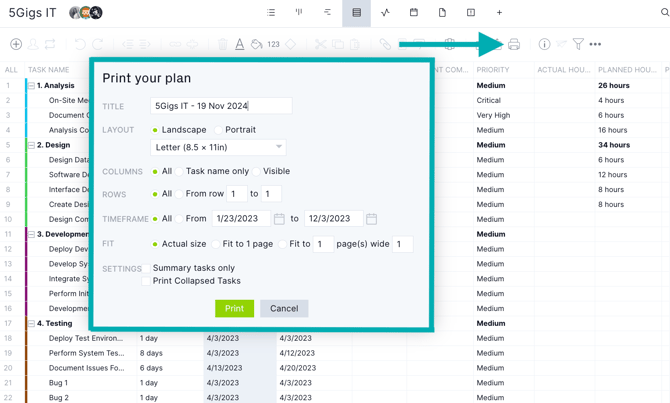
Print the Gantt
Print the Gantt chart exactly as it appears on your screen or customize it to show only the data you want to see. Learn more about printing the Gantt chart.
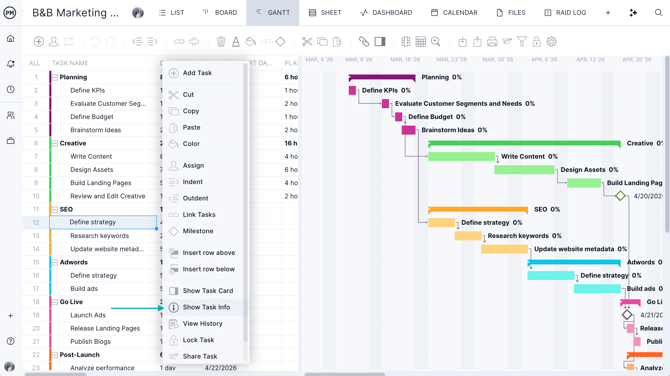
Task Information Panel
You can access the task information panel by right-clicking the name of a task. A menu will appear where you can select "show task info." The panel will then appear at the bottom of the page.
- The task information panel allows you to easily see and edit all the information about a task such as dependencies, lag, and more.
- Seamlessly create new tasks and enter task-level details using the task information panel.
- Explore different subsets of the task information panel by clicking on links, people and dependencies.
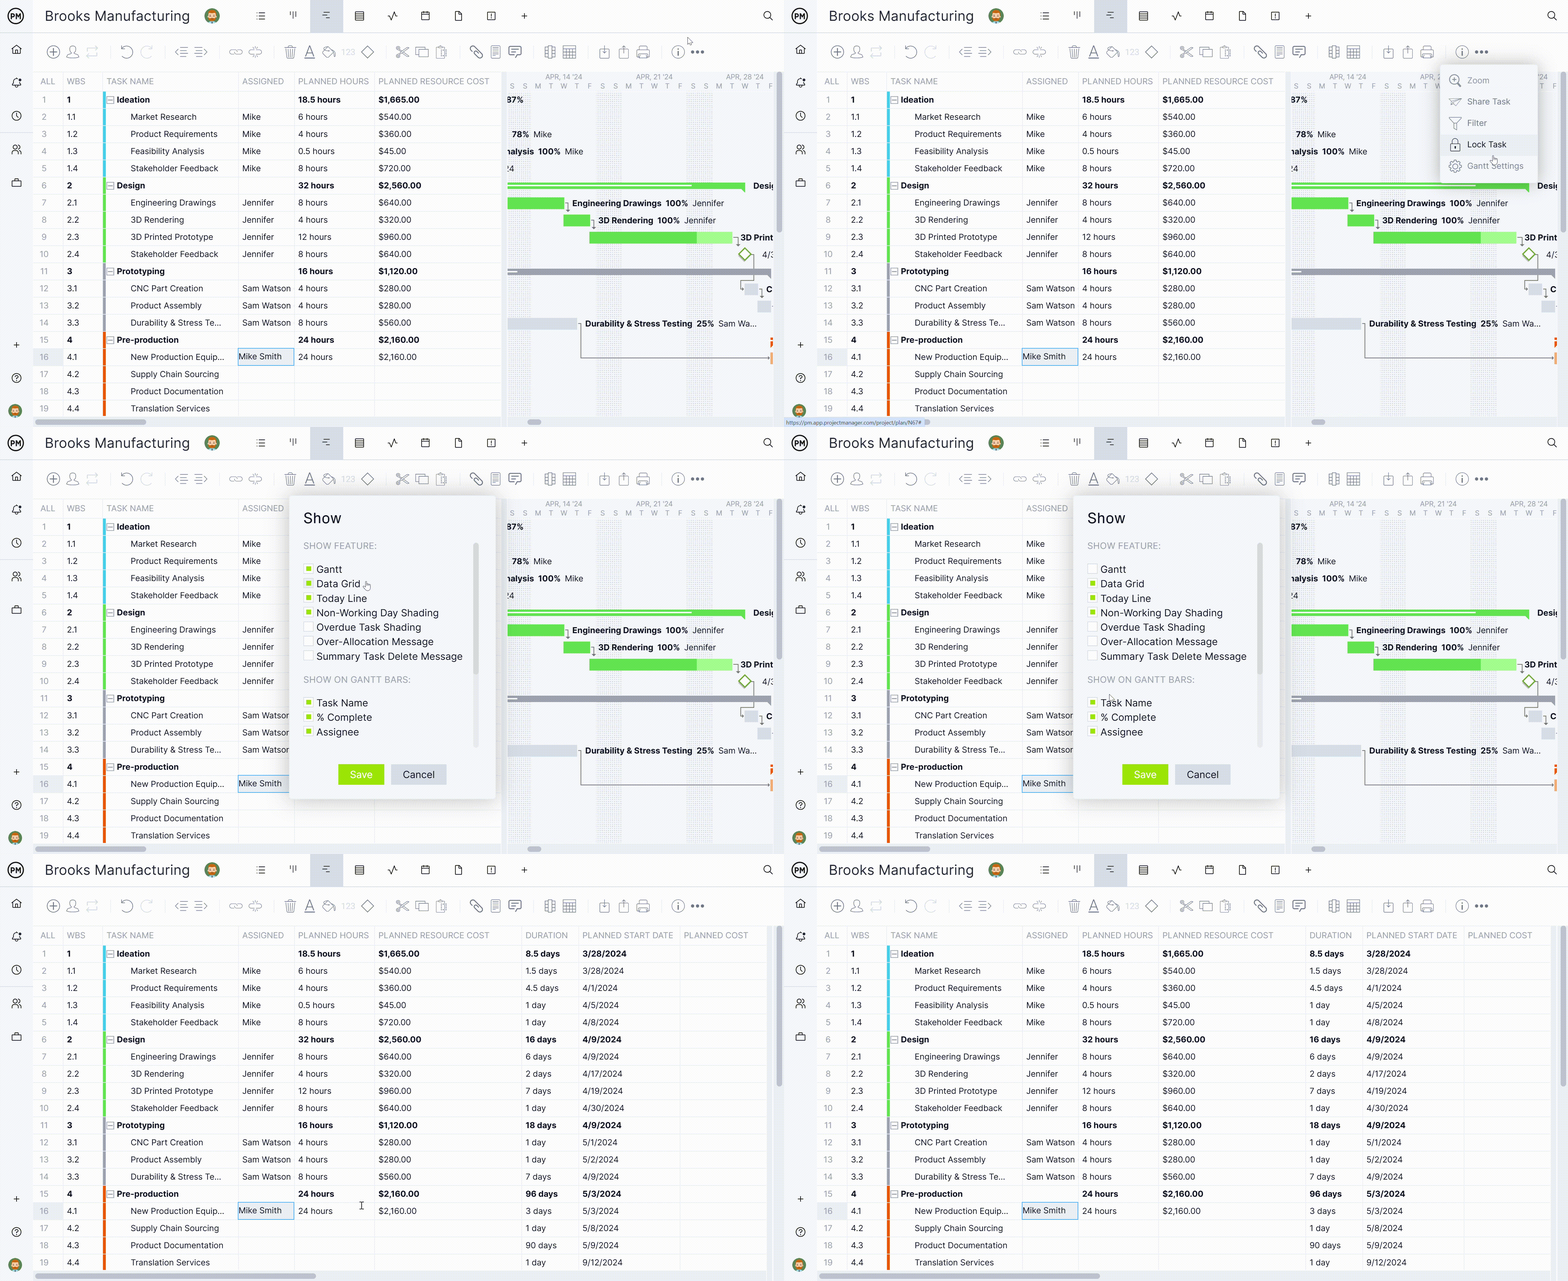
Gantt Chart Settings
Access Gantt settings by clicking the cog wheel on the far right side of the Gantt ribbon. Here you can toggle on or off the following features:
- The Gantt timeline
- The data grid
- Today line
- Non-working day shading
- Overdue task shading
- Over-allocation message
For the Gantt timeline, you can toggle off and on these features:
- Summary task delete message
- Task name
- % Complete
- Assignee
The Gantt timeline is a visual representation of data entered into the project. If you prefer to only see the data graph, you can turn off the Gantt timeline.
Tip: Looking for more Gantt chart articles? Visit the Gantt chart category.
Contact Support with Questions!
Do you have questions on our Gantt chart? We're here to help! Please email support@projectmanager.com with any questions.