Key performance indicators (KPIs) measure long-term performance relating to finances, strategy and operational achievements. Use features including dashboards, reports, Gantt charts, sheets and automation to track KPIs in ProjectManager.
All KPIs update in real time regardless of the view in which changes are made.
Monitor KPIs With Dashboards
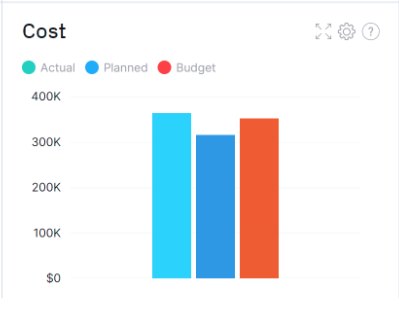
The dashboard can track budgets, task progress and planned completion versus actual completion to keep you on track. This is a great KPI-tracking tool for prefer working with visual data. The project dashboard is broken into six key sections including health, tasks, progress, time, cost and workload.

The cost panel, for example, uses different colors to track planned versus actual costs compared to your budget. Hover over the data on the dashboard for additional information and context.
The tasks panel is another helpful tool to track KPIs as it breaks down the number of tasks not started, complete and in progress for the particular project. Read more about the project dashboard.
Tip: For tracking KPIs across projects, use the portfolio dashboard.
Summarize KPIs With Reports
We offer the following reports: portfolio status, project status, project plan, tasks, timesheets, availability, workload and variance. The filtering option for each report makes it easy to customize the data you want to include such as cost, target date, workload, actual vs. planned hours, actual vs. planned effort, etc.

Once you've selected the data to include, save it as a PDF, Excel or CSV format depending on the type of report. Send it to stakeholders, team members or other relevant parties to share updates on how your KPIs are evolving. Read more about project reports.
Track Baselines on the Gantt and Sheet
Keeping track of relevant dates may be important to several KPIs you're tracking. The project baseline represents the original date you set in a proposal with your customer. It's established when you first create your project schedule. Set a baseline on the Gantt or Sheet view by clicking the gear icon and click "set baseline."
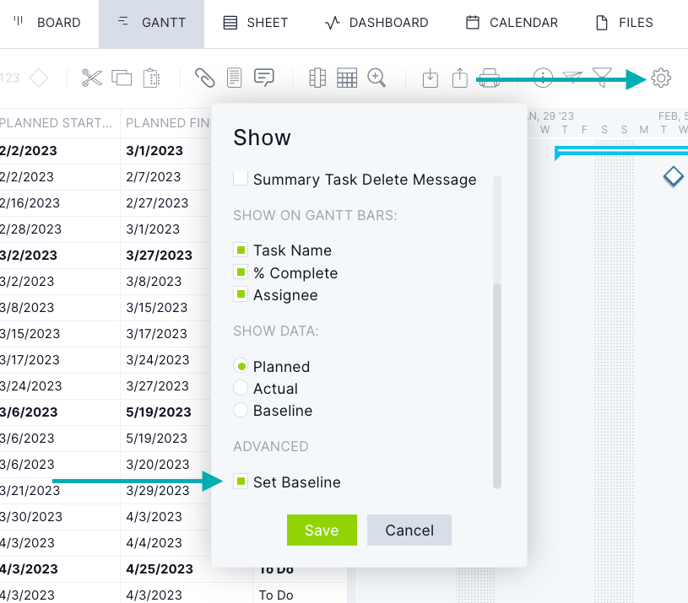
After setting the baseline, the planned start and finish dates automatically populate under the "baseline start date" and "baseline finish date" columns. These dates remain frozen unless you set your baseline again which overrides your previous baseline. The baseline is a great way to track planned versus actual progress, costs and hours.
As planned start and finish dates move, you can see your project variance. Use this data and turn it into a report using the variance report. This report helps determine your project buffer. Read more about how to set a baseline.
Catch KPI Slippage With Automation
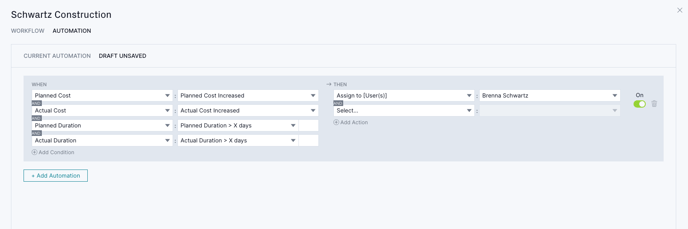
Automation makes it easy to keep track of certain KPIs by closely monitoring how tasks move through workflows. Use them to enforce strict rules on how tasks move through a workflow and define which users can move a task through its various stages.
For example, if the actual cost of a task increases, it can automatically be assigned to a manager for review and final approval.
.png?width=688&height=337&name=image%20(87).png)
Automation is only available on Business and above. Need access? Upgrade your account.
Specifically for KPIs, use automation to keep track of planned and actual costs as well as planned and actual duration to see how this data impacts your projects.
If there's a required approver, he or she will automatically be notified via email (if determined in settings) and within the software.

If you have more questions on how to track KPIs in ProjectManager, email support@projectmanager.com.