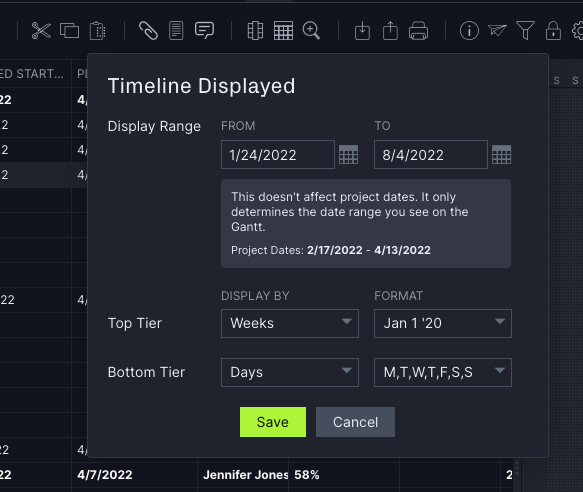
The visual timeline is displayed as the total time visibly displayed on the Gantt (including horizontal scrolling) which matches the “from” and “to” dates on the timeline popup.
If you're looking to condense the Gantt as much as possible, change the top tier to years and the bottom to quarters. This setting works best for plans 12 months or longer in length.
If your project plan has tasks outside your selected date range, you won’t see those tasks displayed. However, you can always reset your Gantt date range if you'd like to again see those tasks.
Visible Timeline on Import
If you import a plan, the Gantt will display the earliest planned start date and latest planned finish date of all tasks in the imported project and automatically set the timeline so that it includes a buffer. The buffer is one full week before the earliest planned start date and six months from the latest planned finish date. You can import up to five years of data.
Email support@projectmanager.com with any questions you have on the Gantt display range!