The ribbon is located at the top of the Gantt chart or Sheet view and includes several icons. You can turn columns on, link tasks, filter and more from the Gantt ribbon.

In addition to the ribbon, you can access these functions via the right-click settings, keyboard shortcuts or from the task info panel.
Here’s a description of the Gantt & Sheet ribbon icons and what you can do:
Add Task
![]()
You can click this button and a new task will be created. The task will be added above the selected cell. You can also start typing in any empty to create a task.
Assign
![]()
Click on a task and use this button to assign team members to work on the task. You can assign users to multiple tasks by selecting multiple tasks at once and selecting the user(s) you would like to assign.
Recurrence
![]()
Click on a task and use this button to make the task recurring. You can use the popup to schedule the task to recur daily, weekly, monthly, or yearly.
Undo & Redo
![]()
You can undo and redo any changes you make on the Gantt. You can undo changes up to 15 times in a row.
Because ProjectManager is concurrent software that supports multiple users working on the same project at the same time, there are some limitations to the undo feature. Some changes to a project may have side effects, for example you may add a link from Task A to Task B which causes the start date of Task B to change. Undoing this action will remove the direct change you made (the link) but may not revert the side effect (the start date). This behavior is required to ensure that multiple users can work concurrently on the project while respecting each user's direct changes while preventing conflicts from side effects.
See also: project version control.
Outdent
![]()
This button performs the opposite function of an indent. It aligns the selected task to the left and removes the task from the rolled-up summary task.
Indent
![]()
The task indent function allows you to create summary tasks. To indent a task, select a task and click the indent button. The task right above it will be a summary task, so the hours, dates and duration are now a rollup of the tasks under it. Since the data is a rollup of the tasks underneath it, you will not be able to manually change summary task data. When a task becomes a summary task, you will lose some data such as dates, assigned hours, and duration but name, description, files, and comments will be retained.
Link
![]()
When this button is clicked, the Link Task popup will appear. There are four different ways to link a task: finish to start, start to finish, start to start or finish to finish. Once a task is linked, the planned dates will move automatically as the duration or the planned dates change. The dates will update based on the type of link.
For example, say you link two tasks with a finish-to-start dependency. If you change the date of the second task to start before the first task, the date will instantly revert to the original date. You would need to remove the link to make this change to the planned start date for the second task.Unlink
![]()
Click this button to remove any links set for the selected task.
Delete
![]()
You can delete a task by clicking the delete button. You will also delete any associated links and subtasks if the task is a summary task.
Text Format
![]()
You can change the font, text color, alignment or style on the Gantt or sheet by clicking this button on the Gantt ribbon. A checkmark will appear next to your current selection.
The text formatting will apply to the entire plan if all rows are selected, or only the rows, columns or cells that are selected. Summary tasks and subtasks can be formatted as well.
Color
![]()
To change the color of the Gantt bar or cells, click the color button. You can also click the arrow dropdown next to any column and select the paint icon to change cells only.
Number Format
![]()
Use this button to format a numerical column. You can update decimal, percent, date or currency options here, depending on the type of column. *This is only active when the date column is highlighted.
Milestone
![]()
You can add a milestone by clicking the diamond icon. Once you click the milestone button, the Gantt taskbar will be replaced with a diamond icon.
Cut
![]()
The cut button allows you to cut and paste a task into another cell. Select a task by clicking on the task's row and selecting the cut button which will outline the task with a dashed line. You can click the target cell in the data grid you'd like to add the task and use the paste function as described below.
Copy
![]()
The copy button allows you to create an identical new task. Click the task's row and select the copy button, which will outline the task with a dashed line. You can then click the target cell where you'd like to add the new task and use the paste function as described below.
Paste
![]()
After you have performed either a cut or copy operation, you will be able to paste the task. You can either select an empty task to paste the content into, or select an existing task and paste the task you have cut or copied into the row immediately above it.
Attach File
![]()
You can attach as many files as you would like to a task. Click on the task and then click on the paperclip icon to attach. Once you have added a file, you will see a paperclip icon in the info column.
Note: If you haven't enabled the info column, you won't see file icons. You can enable the info column by clicking the columns icon.
Add Note
![]()
You can click on any task and add a note to it. You can format your note by adding bullets, headers and more. When you have added a note, the note icon will appear in the info column (marked with a grey notepad icon). Your entire team can then see the notes you have added. On the Board, Calendar and List, notes will appear in the description on the task card.
Add Comment
![]()
Comments allow you to start a discussion with other members of your team. If you @ mention a user, they will get an email and notification with a link to the task. Comments appear as a chat icon on the info column and also appear on the task card.
Columns
![]()
You can turn columns on or off and create custom columns by clicking the columns displayed button. If you turn columns on or off, they're unique to your instance of the software so each team member can customize their view.

Note: If you use a summary task, a custom number or concurrency column will calculate the totals below it.
Calendar
![]()
You can choose the date ranges displayed on the visible timeline of the Gantt and customize your time scale. For example, if your project spans multiple years, you can select years on the top tier and quarters on the bottom tier.
Gantt Zoom
![]()
You can choose to zoom your screen from 100%-500%.
Import
![]()
You can import from the Gantt or import from anywhere using the +New menu from the bottom left. You can import any Excel, CSV or MPP file into the software
Export
![]()
Export your project anytime by clicking the export button inside the Gantt. You can export to Excel, CSV, MPP or an XML file. If you choose the offline option, the file will be emailed to you
![]()
You can save the Gantt as a PDF by clicking this button. Visit the Gantt Print page to learn more about the available print settings.
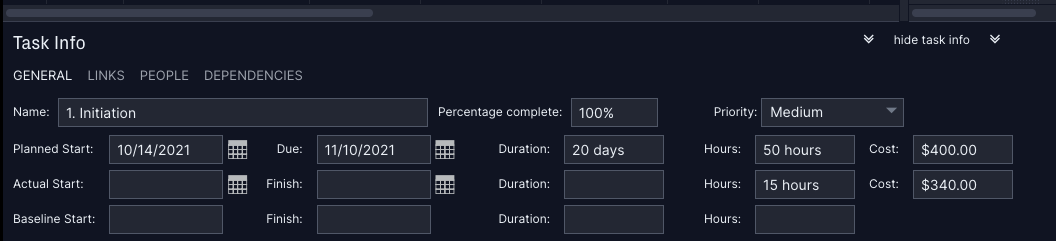
Task Info
![]()
The "i" icon will give you access to the task info panel. When you click it, the panel will appear across the bottom of your Gantt.
Share Task
![]()
Use this button to send a hyperlink to the task to another user in your account. The user will receive the hyperlink via email and notification.
Filter
![]()
You can choose from one of eight filters such as critical path, milestone tasks, overdue tasks and more. If a filter is turned on, you'll see a green filter icon with a dot that tells you the filter is turned on and allows you to easily turn it off by clicking.

Lock Task
![]()
You can lock a task to prevent users from changing the task's planned duration, start date and finish date. If a task is locked, you can click this button to unlock it.
Gantt Settings
Settings allow you to change the view on the Gantt. For example, you can choose to hide the Gantt entirely or turn on overdue task shading. You can customize the Gantt bars by choosing to display the task name. Percent complete, assignee or a combination of all three. You can find the definition for each setting here.

Ellipses
The ellipses will appear when viewing the Gantt on a smaller screen. Click the ellipses to display any icons that you do not see in the ribbon menu.
Looking for more Gantt chart articles? Visit the Gantt chart category.
Please email support@projectmanager.com with any questions on the Gantt ribbon!