Some features mentioned below are only available on certain editions, learn more.
We love the construction industry and countless construction teams rely on ProjectManager for everything from preconstruction to the final punch list and site walkthrough.
Let's look at example use cases that we commonly see with construction teams.
Build your construction plan on the Gantt chart
The Gantt chart is one of the most helpful views for construction teams. A construction Gantt chart can:
- Create a construction schedule
- Monitor the progress of construction activities
- Estimate the total duration of a construction project
- Identify task dependencies
- Find the critical path of a project
- Allocate resources and track resource allocation
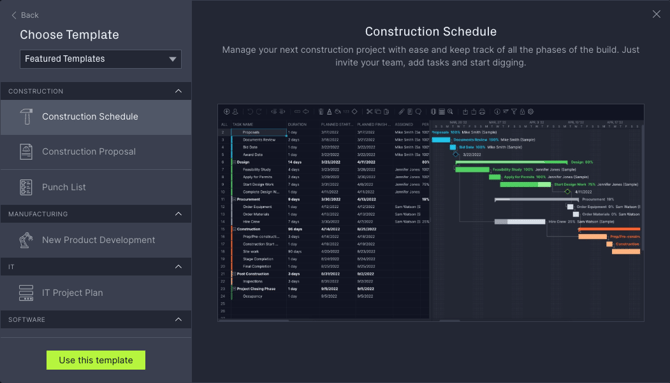
If you don't already have an existing project, you'll want to create a new project and give it a name.
Tip! You can also get started using the construction schedule template as it will facilitate the process of creating a construction Gantt chart. You'll simply need to replace the data in the template with your construction schedule information.
Update project settings
Once you've entered your project name, click on the gear icon to update project settings. This is where you'll be able to add a description, set working days, add a target end date and more.
For your project working days, the default days are Monday-Friday, but you can add Saturday and Sunday as working days if you need to schedule tasks on the weekends.
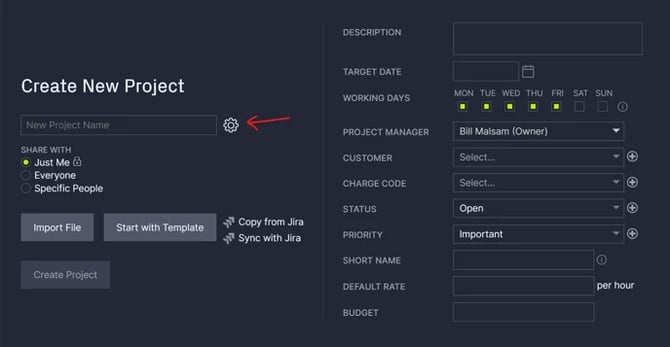
Tip: Project working days can ONLY be updated when creating a project.
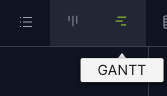
Then, navigate to the Gantt view to build your project schedule. You can find it across the top menu and it's represented by the icon below.
Enter tasks into the data grid
On the left side of the Gantt chart is the data grid where you can enter all of your task details including the task name, assignee, planned hours, planned resource costs, planned start date, planned finish date and more.
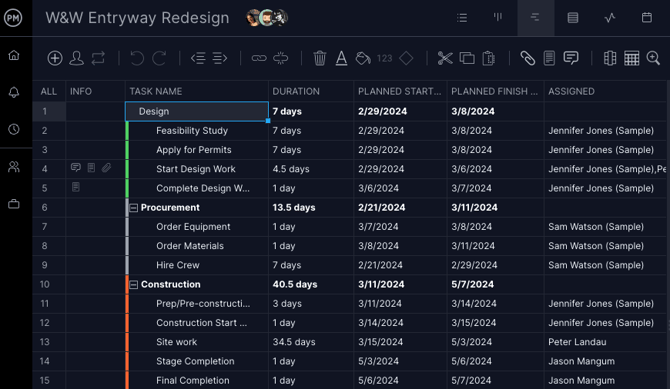
Each project task is listed one per row. Depending on the columns that you have, you can list your duration for each task, including the start and end dates.
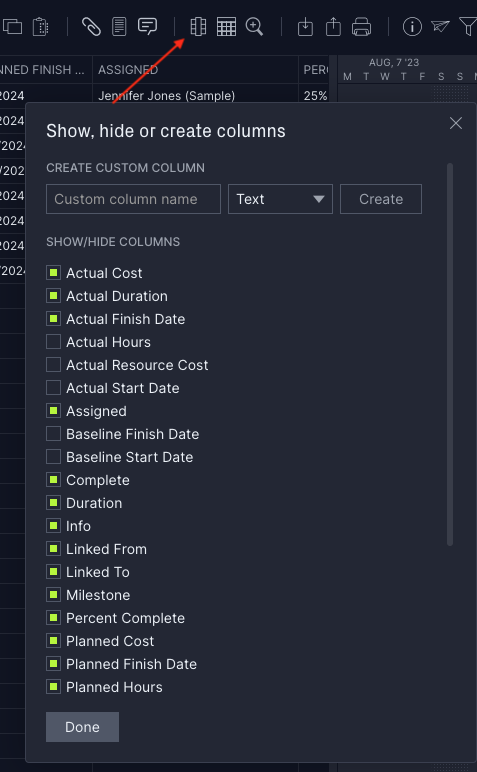
Make customizations
It's easy to make customizations to which columns appear. Locate the "columns" icon as highlighted below and check or uncheck any columns that you want to appear.
Understand the Gantt timeline
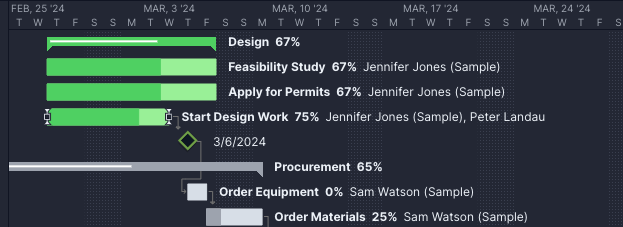
As you make changes to the data grid on the left, the Gantt timeline on the right will automatically update. This data is all interconnected, so any changes that you make to the data grid will automatically reflect on the Gantt timeline.
For example, if the feasibility study takes longer to complete, simply drag and drop the timeline in the Gantt. This is perfect for making last-minute construction schedule adjustments, and any dependent tasks will also automatically update.
Set dependent tasks
We support all four types of dependent tasks. To create a dependency on the Gantt, click and hold on a taskbar and move your mouse until a dotted line appears. Then, drag the dotted line to the link task. When you let go of your mouse, the solid line shows that the dependency was created.
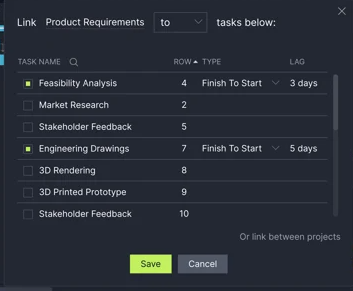
You can also click the link button on the Gantt chart. First, highlight the task you'd like to link to or from and then click the link button. The below popup will appear and display the task you're linking to or from on the first line. You can even link between projects.
Determine summary tasks
Summary tasks are also referred to as parent tasks. They allow you to report on the phases of your project at a high level. To add a summary task, begin by adding your tasks into the Gantt chart. Once you've added your tasks, decide which one(s) will be the summary task.
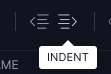
Select all rows at the same time below the desired summary task and click the indent button.
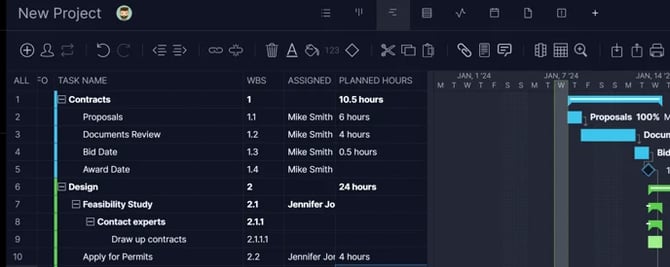
The summary task will turn bold and a plus button will appear next to it, allowing you to hide or show the sub-tasks. In the example below, "contracts" and "design" are both summary tasks. The tasks housed under them, such as "proposals" and "draw up contracts" are subtasks.
Keep in mind that when a task becomes a summary task, you'll lose some data such as dates, assigned hours and duration name. The task name, assignees, description, files and comments will all be retained.
Add a work breakdown structure
The Gantt chart also allows you to create a work breakdown structure that's as simple or detailed as you need it to be. Using a WBS can help with organization, resource allocation, change management, performance tracking and more.
Make sure the "WBS" column is checked so it appears, and you can use the indent and outdent buttons as needed to break down tasks into subtasks.
Track and print your construction schedule
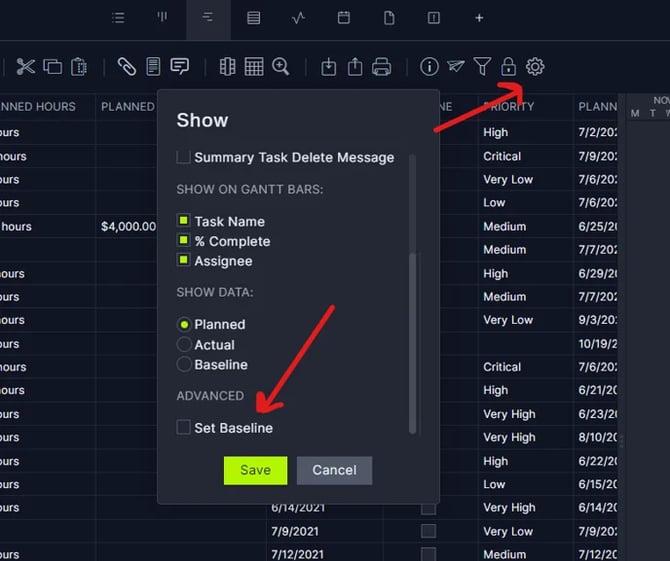
Baselines are another helpful feature when setting up your construction project. For construction teams, the baseline is often established when an official proposal is submitted, rotating the official start date of the project. To set a baseline, click on the settings button and you'll see the "set baseline" option under the advanced settings.
Once a baseline is set, you'll see your planned start and finish dates populate under the baseline start and finish columns. These dates are frozen unless you set your baseline again, which will override your previous baseline.
If plans change and you need to make adjustments to your construction plan, you can use the Gantt chart to oversee planned vs. actual data and compare it to the baseline.
Other things you can track with our Gantt chart include:
- Resources with real-time availability
- Costs
- Actual vs. planned data
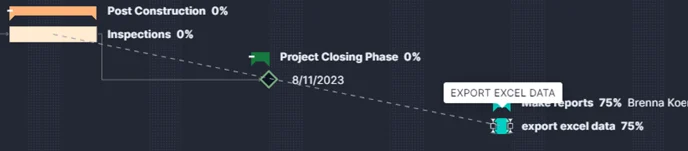
- Milestones (represented by the diamond "milestone" button on the Gantt menu)
Once you've made your construction schedule, you can even print it out using the print icon in the upper right-hand corner of the Gantt. Hang it on the office wall to reference or bring it to the job site.
Printing the Gantt
See our comprehensive guide on how to print the Gantt chart.
Use project dashboards to oversee progress
Another way to track progress is by using our project dashboard view. Here, you'll find a summary of essential project data broken out into six different categories: health, tasks, progress, time, cost and workload.
As data changes across the software, these changes automatically reflect in the dashboard view.
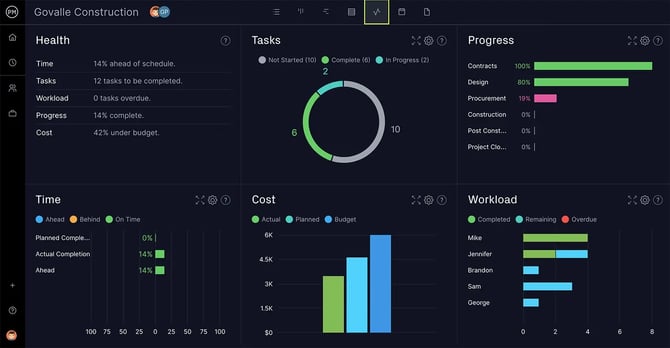
You can hover over each area of the dashboard to get additional information on the data. Feel free to customize the data that appears on each area of the dashboard by clicking the small gear icon.
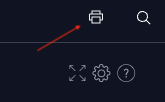
Printing the dashboard
If needed, you can also download and print the dashboard by clicking on the print icon in the upper right-hand corner of the page.
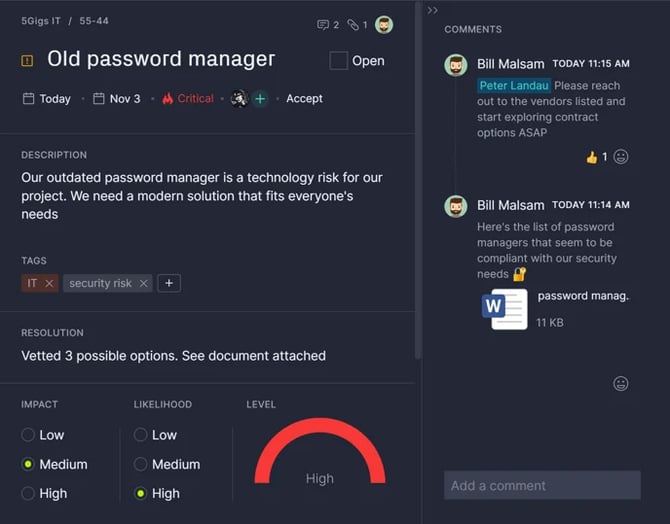
Manage risks
As you continue making progress throughout the project, don't forget that you can also manage risks in ProjectManager. For those on the Business edition or above, our risk management feature allows you to use the task card to track the impact and likelihood of a project risk occurring.
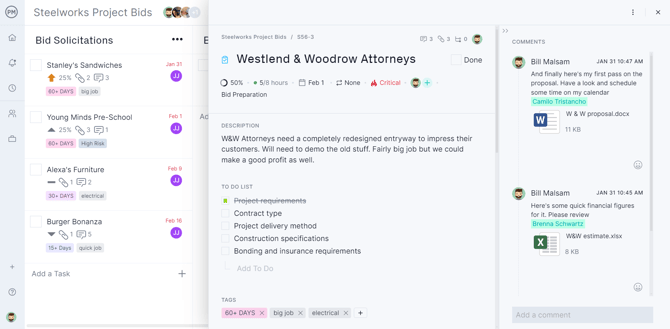
Use the kanban board to manage the bidding process
When you're submitting a response to an RFP or a request for proposal, you'll need an organized method to keep track of the stage that each document is in. You can customize the columns on your kanban board to help with the bidding process and provide instant visibility to your team.
For example, you'll see below that the construction company has created various columns to track the bids as they move from the solicitation stage to the finalization stage.
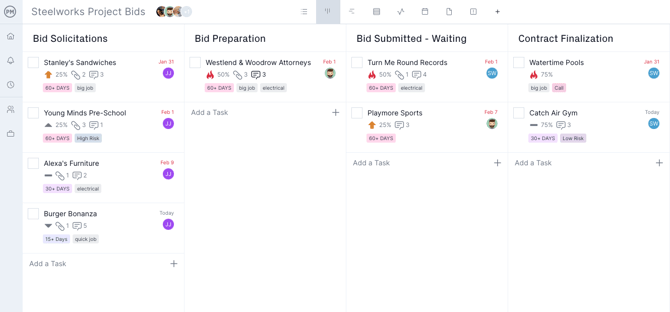
On the board view, it's easy to add documents, tags and priority levels. As you make progress on tasks, relevant team members will be notified so everyone is aware of the status.
Having a streamlined approach to bid management allows project owners to make informed and unbiased decisions while promoting collaboration. When changes are needed or documents need to be shared, simply make comments on each particular task and tag relevant team members.
Other examples of how to use the kanban board for construction projects include:
- Determine which pieces of equipment have approvals outstanding
- Anticipate how resources will be used across projects
- Visualize what work hasn't started, what work is in progress and what work is completed
- Synchronize work between multiple construction sites
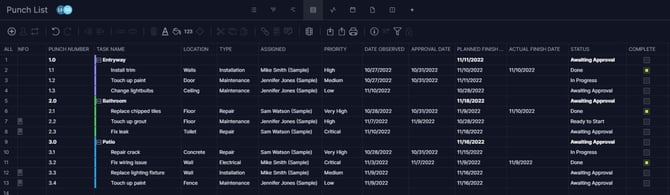
Create a punch list using the list view
Your construction project isn't finished until your punch list has been completed. Create your punch list on the list view to keep track of all completed tasks and any tasks that are still outstanding.
The example below uses tasks and subtasks to keep track of the punch list.
-Feb-27-2024-05-02-38-4746-PM.png?width=670&height=329&name=image%20(2)-Feb-27-2024-05-02-38-4746-PM.png)
Just as you customize your Gantt chart columns, you can do the same for your punch list. Using the task list as your punch list can help you avoid any missing crucial work and ensure that your work order meets all needed project specifications.
Upload photos from the job site using the mobile app
When filling out the punch list, you can also download the mobile app to upload photos directly from the job site when you're taking your final walkthrough. Unlimited file storage makes it easy to be as detailed as you need so that your project is successful.
To get started on your punch list quickly, feel free to use our punch list template inside of ProjectManager.
Generate reports
Before you close out a project that's no longer needed, you can generate relevant reports in a few clicks.
We offer the following reports: portfolio status, project status, project plan, tasks, timesheets, availability, workload and variance.

Collaborate with your team
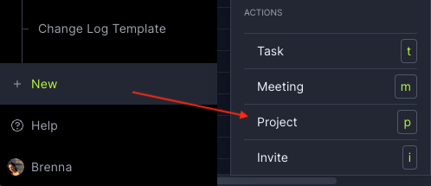
Invite your team
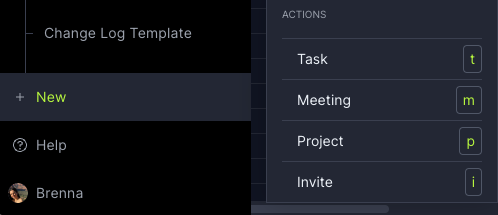
Now that your project is set up, you'll need to invite your team members. Invite your team via the "+New" button or from the manage users page.
You'll need to fill in the team member's first name, last name and email address. You can easily invite another person in the same popup or invite multiple people at once.
Select the projects that they should have access to by using the dropdown menu. If you don’t have projects created yet or don’t want the user to have access, you can give them access later. Click send invite and the user will receive an email with a link to log in.
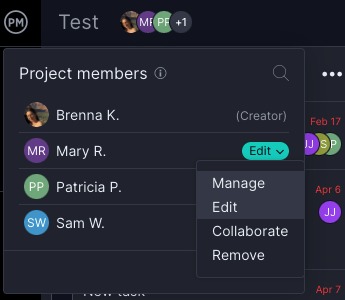
Edit team access
As you onboard your team, you'll be able to set specific roles. This enables you to directly control the level of access each team member has.
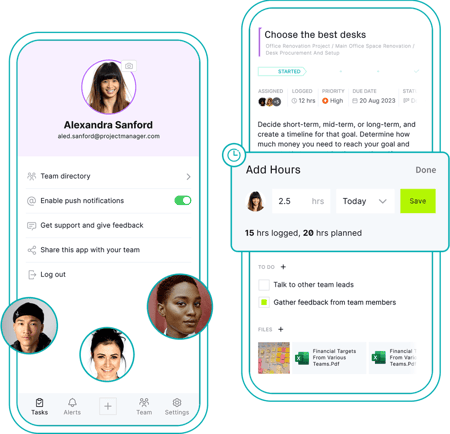
Balance workloads
Let's say you want to assign your team to tasks using real-time availability. Click on the "assigned" column in the corresponding task and start to search for the person you'd like to assign the task to.
You'll see that the person's availability will automatically populate. Hover over the "availability" number for more information, and this is determined by the user setting. In this example below, Mike Cranston has 12 available hours, always factoring in things like holidays. Learn more about resource management.
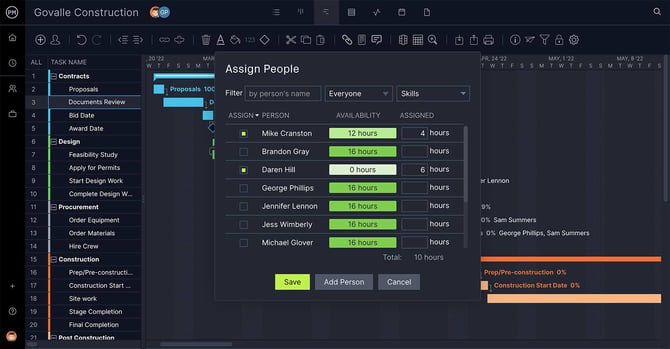
The planned resource cost is determined by the labor rate that you set for each particular team member.
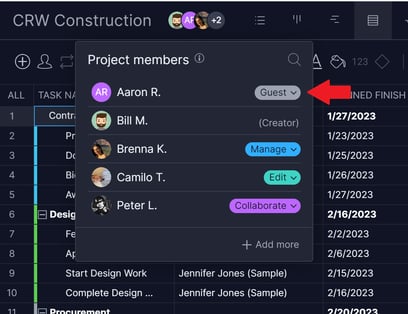
Invite guests
If you're on the Business edition, you'll be able to invite up to 5 people as guests (Enterprise users get unlimited free guest licenses). Guest licenses enable people to have read-only access to project plans, project status, milestones and dashboards.
Note that guests won't be able to collaborate on projects or tasks, but they'll be able to see pertinent details and insights.
Collaborate in different project views
Navigate to different project views to start collaborating with your team and monitoring the project's progress. In addition to the Gantt chart, our project views include:
To navigate to our other project views, use the top navigation menu. You can hover over each icon to see what view it is.
If you have any questions about the above content or you're interested in learning more about managing construction projects in ProjectManager, you can always reach us at support@projectmanager.com.